The Kubernetes Dashboard is a web-based user interface that provides a graphical interface to manage and monitor Kubernetes clusters. Users can view and manage their applications, troubleshoot issues, and access important cluster information. Openlens GUI, also known as Lens, is one of the popular Kubernetes Dashboard tools that provides an enhanced user experience for managing Kubernetes clusters. It is an open-source, feature-rich desktop application that offers a more comprehensive and easy-to-use interface.
Features of Openlens GUI include:
- Cluster Management: Lens allows users to manage multiple Kubernetes clusters from a single dashboard. It provides a unified view of the clusters and enables seamless switching between contexts.
- Real-time Monitoring: Lens provides real-time monitoring capabilities, allowing users to monitor cluster health, resource utilization, and workload performance.
- Enhanced Visualization: Openlens GUI offers a more intuitive and visually appealing representation of Kubernetes resources, allowing users to navigate and understand the structure of the cluster.
- Advanced Troubleshooting: Lens simplifies troubleshooting by providing detailed views of containers, pods, and their logs. It also offers powerful search and filter capabilities.
- Security and Access Controls: Openlens GUI supports role-based access control (RBAC), allowing users to define granular access permissions for different team members. It also ensures secure access to cluster resources.
First Dashboard and Matrices from a Cluster
As a prerequisite, download OpenLens 6.1.19.exe
Step 1. Open OpenLens.
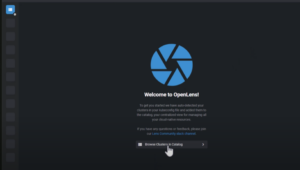
Step 2. Click on one of the clusters, for example, vsherek8s.
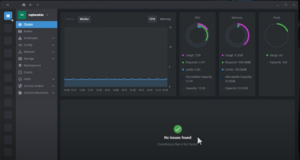
Here, you can see the dashboard that automatically gets the metrics from your cluster like graphical destinations for CPU, memory, and running pods. Also, you can see the health of the cluster. If there are errors or issues, OpenLens automatically flags and presents them on the home screen dashboard.
How do you get integration with OpenLens?
Step 1. Navigate to the left panel and click Settings under the cluster name.
Step 2. Go down to Lens Metrics under EXTENSIONS.
Step 3. Toggle on Enable bundle Prometheus metrics stack.
Step 4. Return to the main dashboard, navigate to the left panel, and click on nodes.
You can see the list of configured physical Kubernetes nodes in the clusters. For each node, you can launch a shell to a specific node, codon, drain, edit, and delete the node.

Workloads and Information
Step 1. Navigate to the left panel, click on Workloads, and click Overview.
Step 2. Change the Namespace default to All namespaces.
Now, you will get feature-rich information regarding the pods, deployments, daemon sets, stateful sets, replica sets, jobs, and cron jobs. If you scroll down, you can see the event-related information.
Step 3. Click on Pods under Workloads. Then, search for the specific pod.
Here, you get the options like attach pod, shell, logs, edit, and delete.

Network information
Navigate to the left panel and click the Services under Network. You can see the cluster’s name, namespace, configuration type, cluster IP, ports, and more.
If you navigate to the left panel and click the Network, you will get endpoints, ingresses, network policies, and port forwarding.
OpenLens Hotbar
Click the clusters vsherek8s. Then click Add to Hotbar. Again, click the cluster name to disconnect and add another cluster.
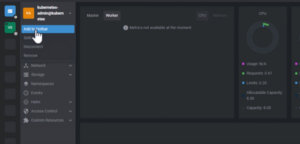
And you can switch between them from the Hotbar shortcut menu. Also, we can connect to more than one cluster at a time.
Conclusion
OpenLens is a perfect solution for a Graphical User Interface for interacting with Kubernetes clusters. OpenLens GUI is an open-source tool that makes it easier for users to navigate, troubleshoot, and optimize their containerized applications.
Xieles team can give you the best experience on this Kubernetes dashboard tool.


